
Semiconductor maker Advanced Micro Devices (AMD) issued a third-quarter revenue warning Thursday after the close of trading. Let’s check on the charts and indicators again. Our last review on September 27 was not encouraging.
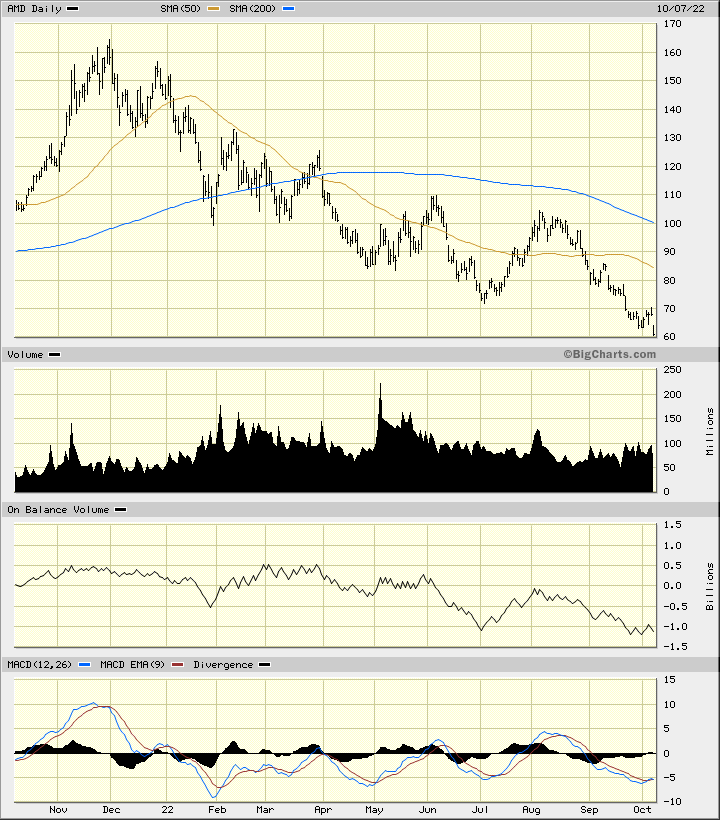
In the daily bar chart of AMD, below, we can see that the shares gapped lower Friday morning and reached a new 52-week low. Prices remain in a downward trend and trade below the weak 50-day and 200-day moving average lines.
The daily On-Balance-Volume (OBV) line is pointed down as sellers of AMD have been more active on days when the stock has closed lower. The Moving Average Convergence Divergence (MACD) oscillator is bearish but potentially close to a cover shorts buy signal.
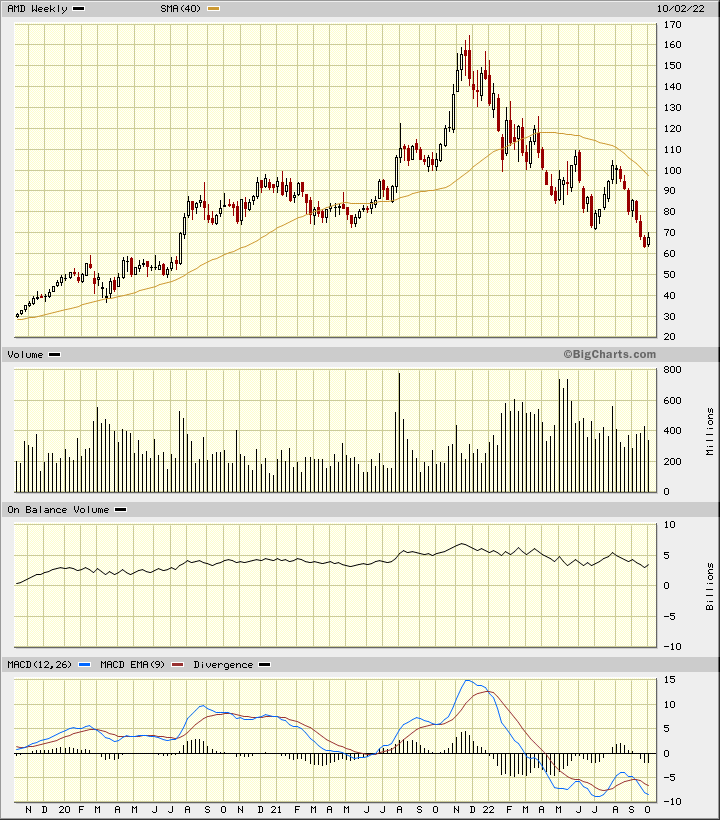
In the weekly Japanese candlestick chart of AMD, below, we see a bearish picture. Prices remain in a longer-term downward trend as they below the negatively sloped 40-week moving average line. The weekly candles have yet to show us a bottom reversal pattern. Potential chart support is only psychological as it is so far back in history.
The OBV line is pointed down and the MACD oscillator is bearish.
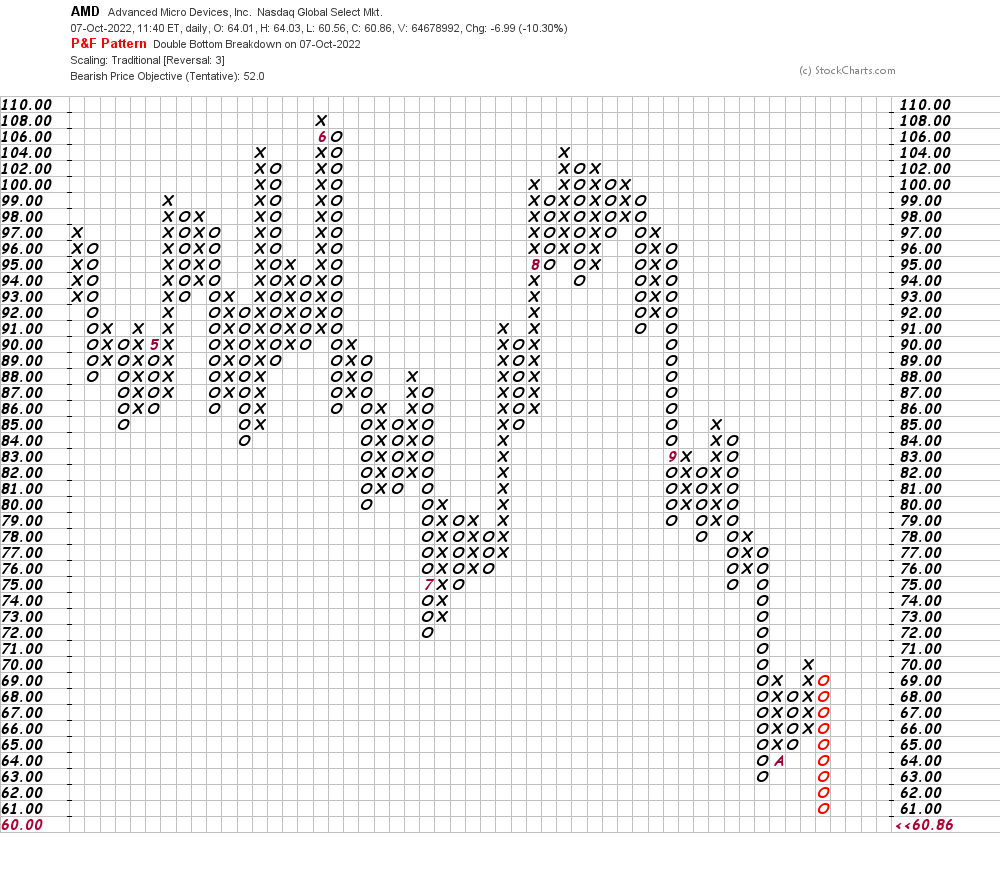
In this daily Point and Figure chart of AMD, below, we can see a downside price target in the $52 area.
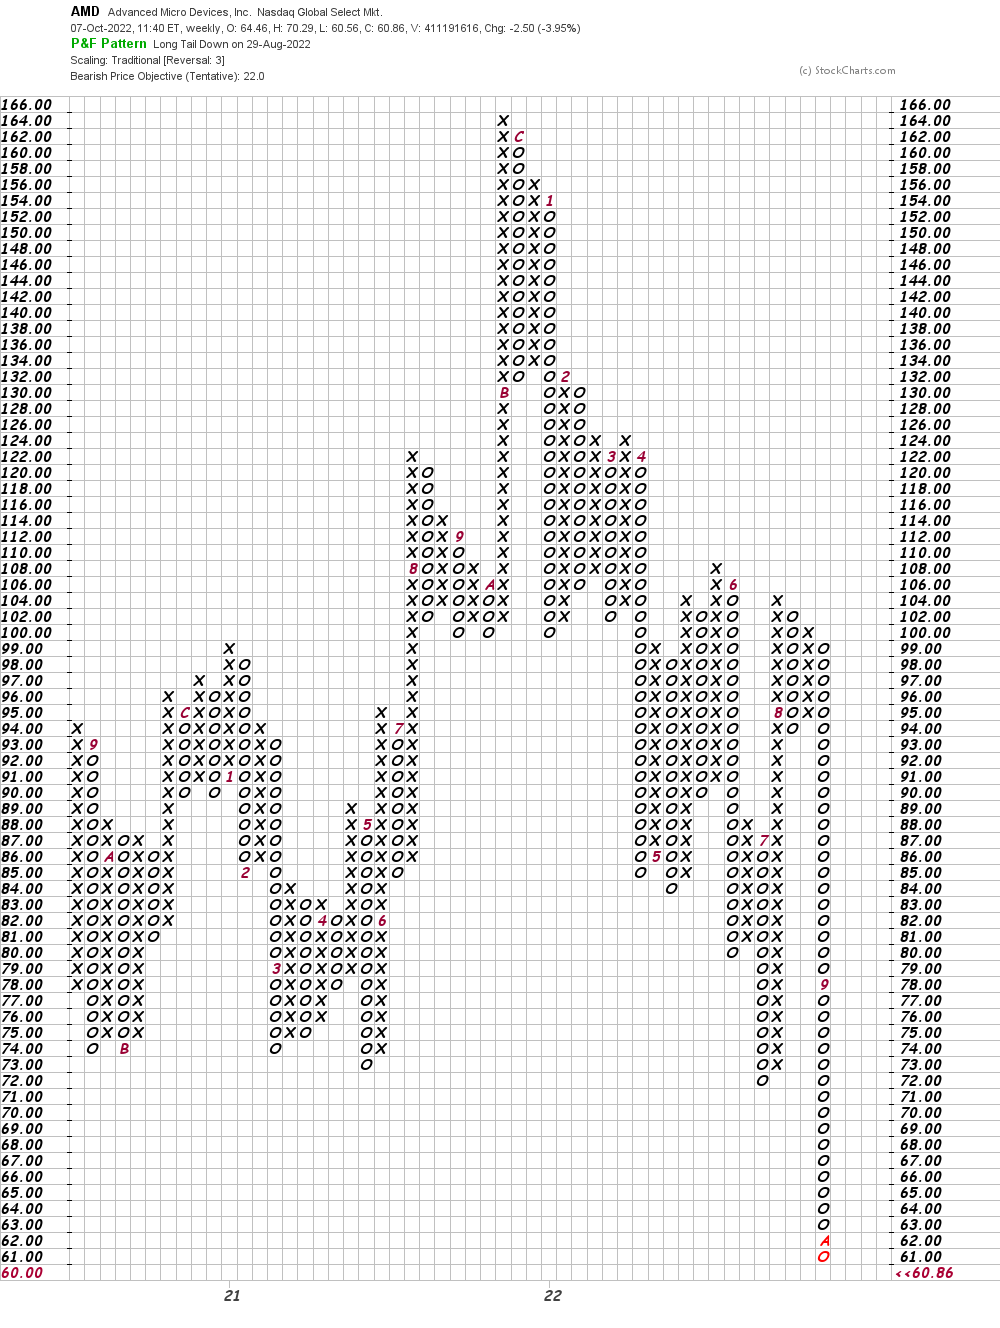
In this weekly Point and Figure chart of AMD, below, we can see that the software is projecting a potential bearish target in the $22 area — ouch.
Bottom-line strategy: Unfortunately I do not (yet) see the start of a bottoming process on shares of AMD. Avoid the long side of the stock as further declines seem likely.
Get an email alert each time I write an article for Real Money. Click the “+Follow” next to my byline to this article.


 | Hollywood.com Movie Trailers")
