
Bitcoin price was able to clear the $17,000 resistance. BTC is consolidating gains and might remain supported above the $16,750 level.
- Bitcoin gained pace and cleared the $16,800 and $17,000 resistance levels.
- The price is trading above $16,800 and the 100 hourly simple moving average.
- There is a key bullish trend line forming with support near $16,950 on the hourly chart of the BTC/USD pair (data feed from Kraken).
- The pair could rise further if it stays above the $16,500 support zone.
Bitcoin Price Extends Gains
Bitcoin price remained well bid above the $16,500 support zone. BTC gained pace and was able to clear the $16,800 resistance zone plus the 100 hourly simple moving average.
The upward move was such that the price even surpassed the $17,000 resistance zone. It traded as high as $17,250 before the bulls faced sellers. It is now consolidating gains above the $17,000 level. The price is trading near the 23.6% Fib retracement level of the upward move from the $16,690 swing low to $17,250 high.
Bitcoin price is now trading above $16,800 and the 100 hourly simple moving average. There is also a key bullish trend line forming with support near $16,950 on the hourly chart of the BTC/USD pair.
On the upside, an immediate resistance is near the $17,950 level. The first major resistance is near the $17,500 zone, above which the price may perhaps start another steady increase. In the stated case, the price could rise towards the $18,000 resistance.
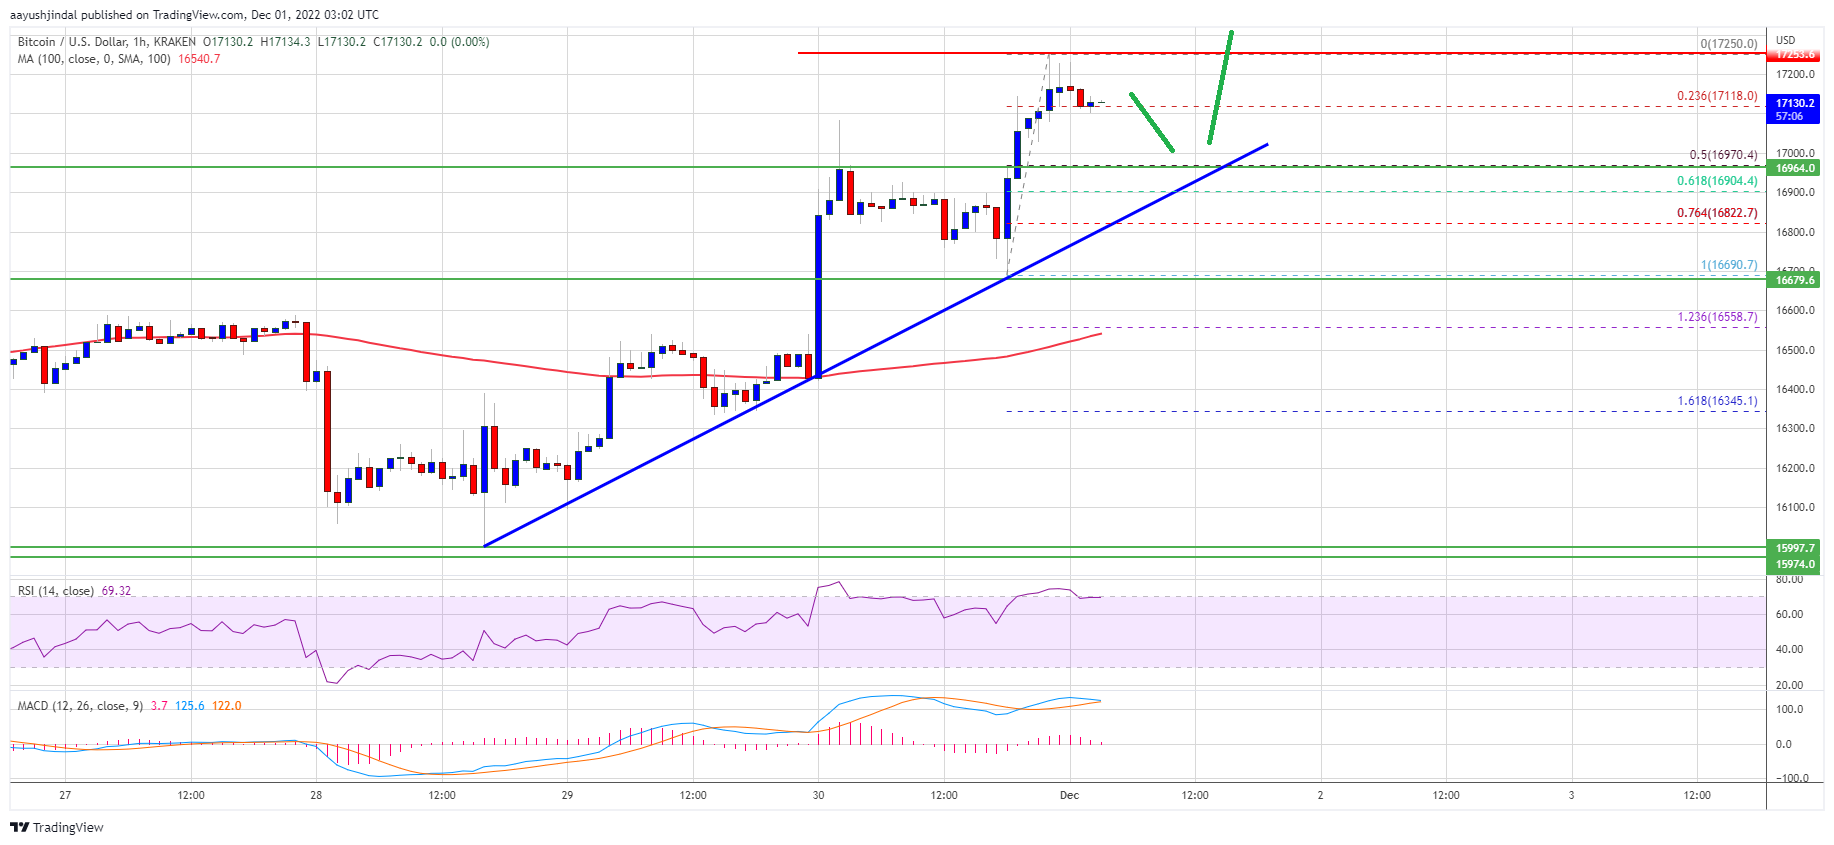
Source: BTCUSD on TradingView.com
The next major resistance is near $18,800, above which the price could gain pace for a move towards the $19,500 zone in the near term.
Dips Limited in BTC?
If bitcoin fails to climb above the $17,250 resistance, there could be a downside correction. An immediate support on the downside is near the $17,000 level. The next major support is near the $16,950 zone and the trend line.
The trend line is close to the 50% Fib retracement level of the upward move from the $16,690 swing low to $17,250 high. A downside break below the trend line might call for a move towards $16,800. Any more losses might call for a test of the key $16,500 support zone in the near term.
Technical indicators:
Hourly MACD – The MACD is now losing pace in the bullish zone.
Hourly RSI (Relative Strength Index) – The RSI for BTC/USD is now above the 50 level.
Major Support Levels – $16,950, followed by $16,800.
Major Resistance Levels – $17,250, $17,500 and $18,000.


 | Hollywood.com Movie Trailers")
