
Nikada/iStock via Getty Images
Market volatility will be in the crosshairs come this week as investors await key inflation report readings that are on the economic docket. The important release of the Consumer Price Index report and Producer Price Index report should shed some clues to the Fed’s tightening path.
Financial participants observed a cool off in market volatility in the previous week as the major averages ended in the green. PriceVol, a proprietary risk indicator generated by ASYMmetric ETFs outlined an average daily drop in weekly realized volatility from 6.6 to 6.2.
Volatility is an integral part to how investors evaluate the marketplace, and PriceVol is an instrument that is able to measure the complete landscape of the volatility reflected in the S&P 500. Moreover, traditional S&P VIX Index (VIX) readings also were reduced on the week by 14% to $22.79.
Where was volatility seen?
Broad volatility declined as benchmark averages climbed higher this past week. The S&P 500 along with ETFs that mimic its price action such as the SPDR S&P 500 ETF Trust (NYSEARCA:SPY) and Vanguard 500 Index Fund (NYSEARCA:VOO) snapped its losing streak.
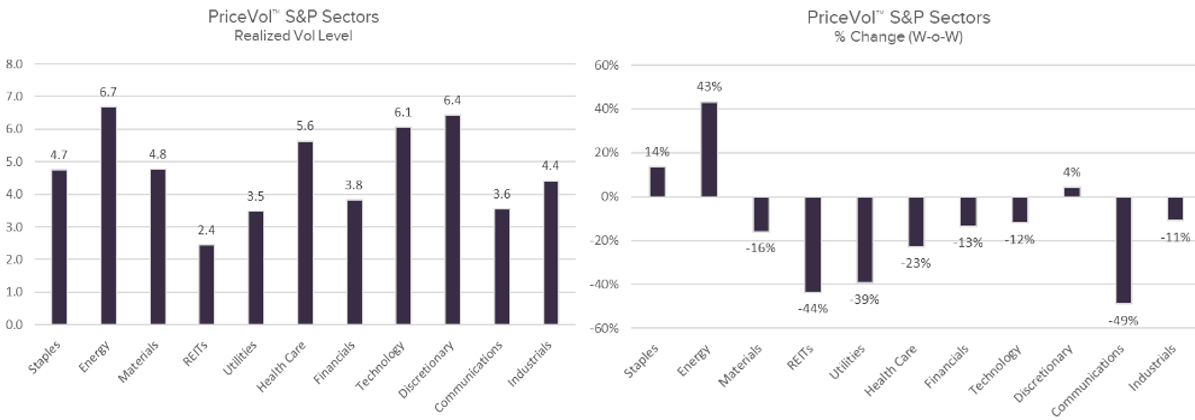
From a sector vantage point, the Energy (XLE) segment of the market observed the highest level of volatility as it had a realized volatility level of 6.7. On the other end of the spectrum the Real Estate (XLRE) sector experienced the lowest level of realized volatility at 2.4.
The Communications (NYSEARCA:XLC) portion of the market noticed the largest W-o-W percentage decline, as it came down by 49% from the previous week to 3.6.
Below is a visual representation of each sector’s state of realized volatility along with its accompanying rate change:
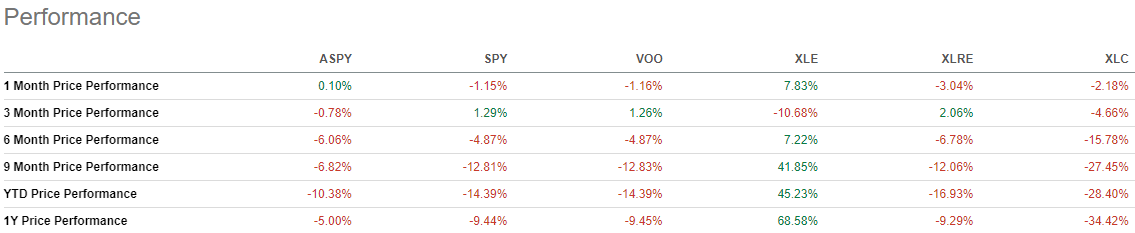
ASYMmetric S&P 500 ETF (NYSEARCA:ASPY) is a fund that was developed from the PriceVol instrument. ASPY works as a quantitative long/short hedging strategy that seeks to offer investors a backstop against bear market selloffs by being net short, while also seeking to capture the majority of bull market gains, by being net long.
See below the performances of all six ETFs discussed across multiple time frames.


 | Hollywood.com Movie Trailers")
